This post is no longer being updated regularly. For current information about COVID-19 in Virginia, please refer to the Virginia Department of Health.
The Commonwealth of Virginia continues to deal with COVID-19 (Coronavirus Disease 2019), a respiratory illness that originated in Wuhan, China, last year and has since spread throughout the world. In an effort to slow the spread of the disease in the Commonwealth, Governor Ralph Northam (D-VA) imposed a number of restrictions. We are now going through a phased reopening.
This post provides citizens of the Commonwealth with important information about the conditions in Virginia and Loudoun County. These charts are all based directly on official data provided by VDH. There are some data anomalies present in VDH data; I do not correct or ‘massage’ any of the data so those anomalies are present in the charts below.
Virginia Statewide
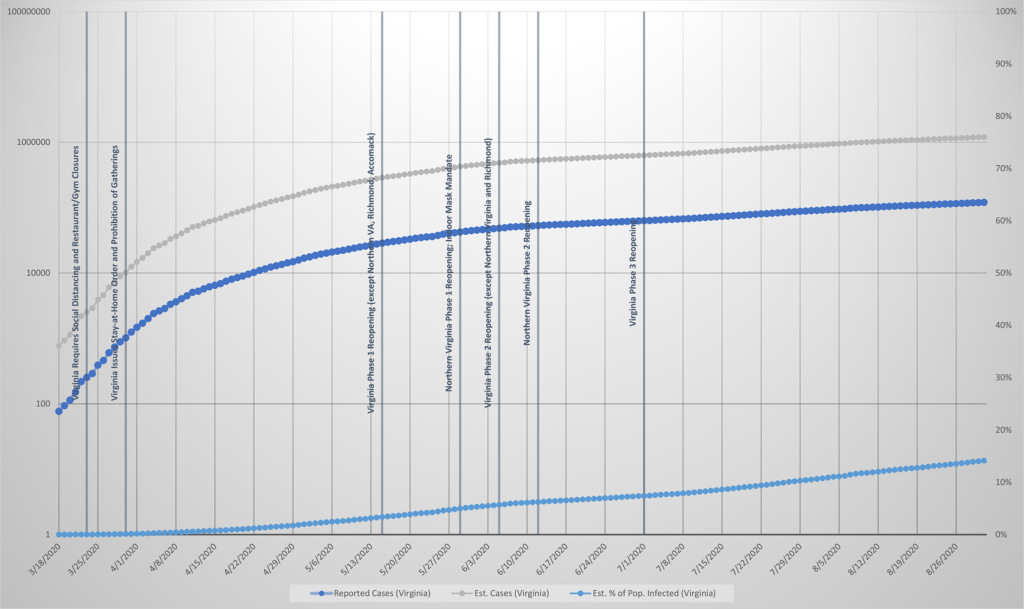
Total Cases (Virginia)
The most obvious method of tracking the spread of COVID-19 in Virginia is to just track the total number of verified cases. This is a useful measure, but it lacks a lot of important context. First, it will always be going up. Second, it is difficult to distinguish how much of the increase is ‘real’ new cases and how much is increased testing.
You can, however, get a general idea of whether the overall ‘curve’ is exponential or linear. To make this extra clear, the data is displayed on a logarithmic scale. Virginia’s curve is linear (i.e., pretty much flat), which means that our mitigation efforts have worked.
Also included in this chart is an estimate of total cases (reported cases multiplied by ten, based on studies like one published in JAMA which have found that “it is likely that greater than 10 times more SARS-CoV-2 infections occurred than the number of reported COVID-19 cases”), and a percentage of population infected (estimated cases divided by U.S. Census Bureau estimate of Virginia’s population).
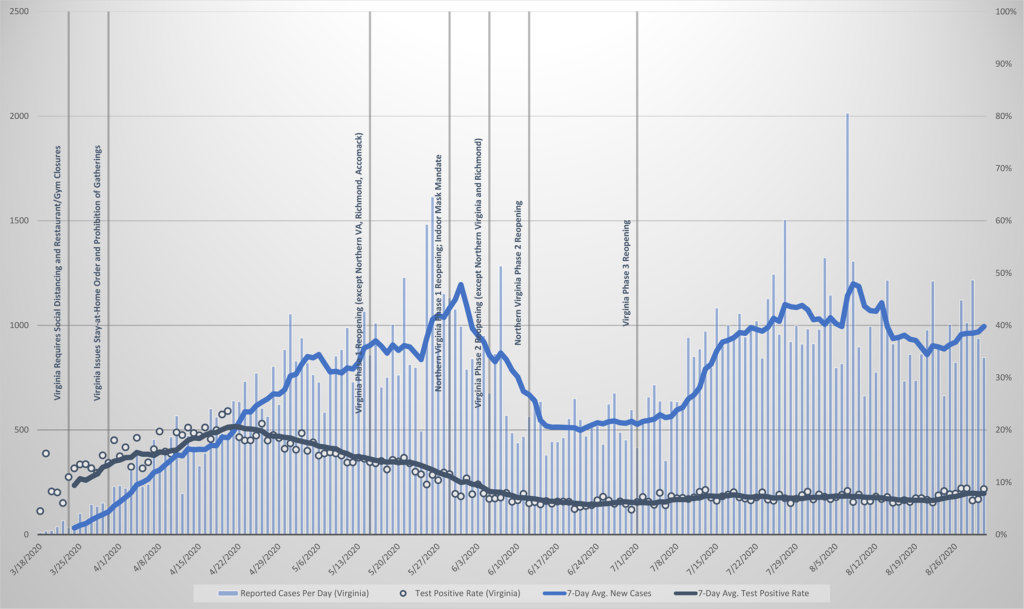
Cases Per Day (Virginia)
A more useful measure is to look at how many new cases are identified each day. It is still very difficult to tell how much of the increase is due to real spread of the virus and how much is due to the increased testing. A more useful measure, overlaid here, is the percentage of tests returning positive.
These measures are basically flat. The solid blue line represents a seven-day moving average, which helps filter out day-to-day swings. The darker blue/gray line shows a seven-day moving average of the percentage of COVID-19 tests returning positive.
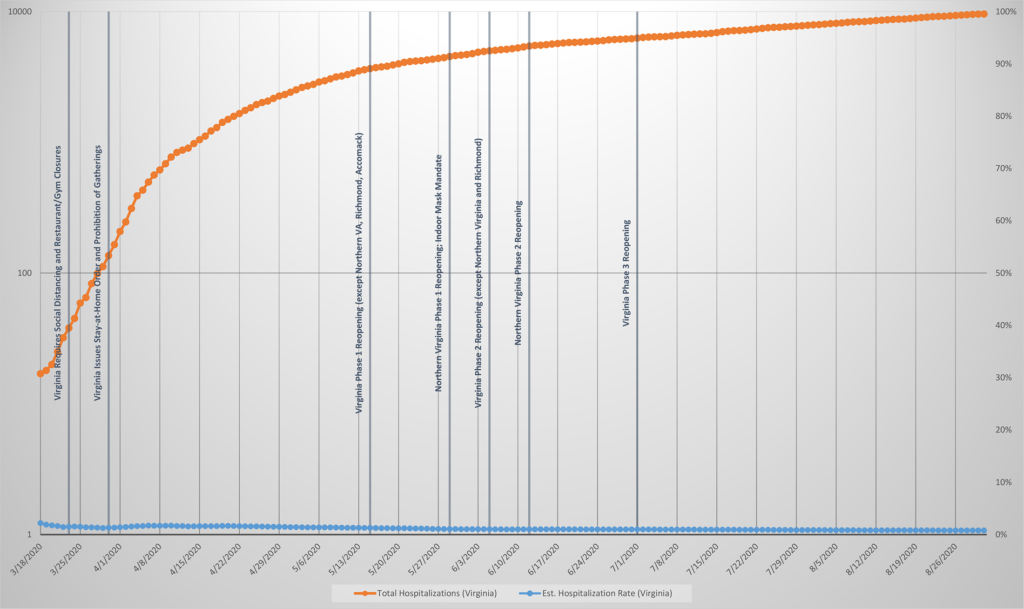
Total Hospitalizations (Virginia)
Tracking the total number of COVID-19 hospitalizations in Virginia is likely a better measure than tracking the raw total of cases. We can assume that the rate of hospitalizations as a percentage of total cases is pretty consistent from day to day, and it is much easier to track accurately than total cases. This doesn’t give us a way to calculate how many infections there really are, but it does serve as a reasonable proxy for the shape of the curve and whether it is exponential or linear.
I have also included an estimated hospitalization rate in light blue, which is calculated using the reported hospitalizations and the estimated number of cases. Data suggests that only about 0.8% of cases require hospitalization.
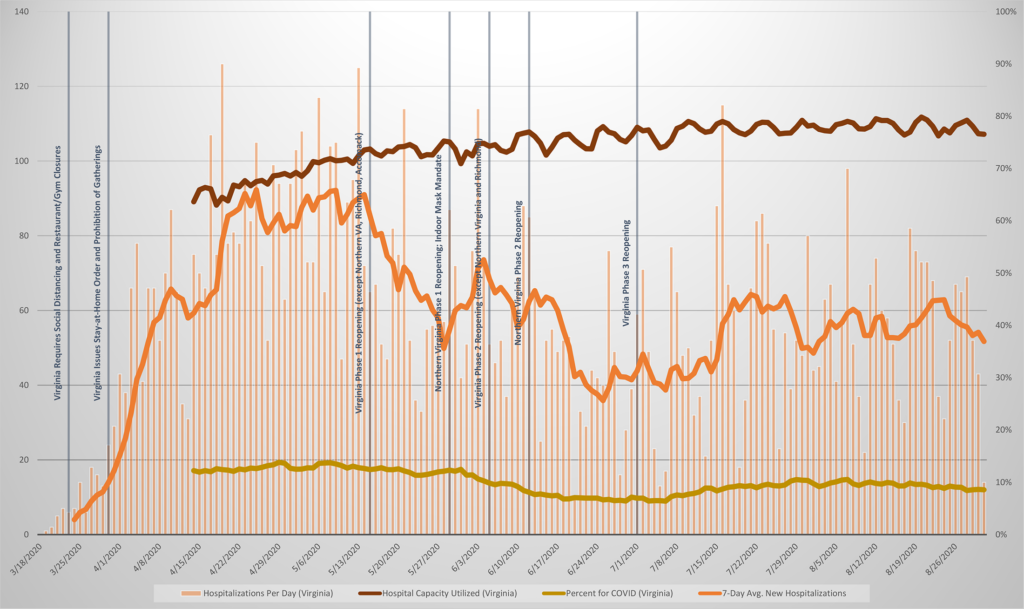
Hospitalizations Per Day (Virginia)
Like the number of new cases per day is probably a better measure of progress than the raw chart of total cases, likewise a chart of new hospitalizations per day is more useful than the chart of total hospitalizations. Here there is a much clearer indication that Virginia’s curve has flattened out. We are past the peak and new hospitalizations are continuing to trend downward, albeit with occasional spikes and plateaus. The percentage of occupied hospital beds utilized by COVID-19 patients is steady around ten percent, and total hospital utilization is steady around seventy-five percent.
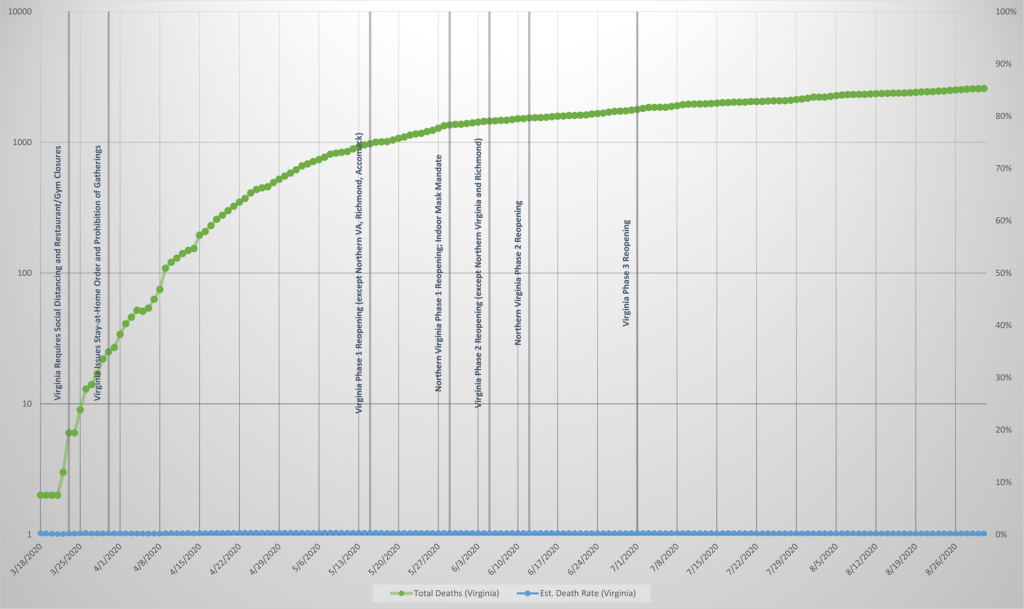
Total Deaths (Virginia)
Some argue that tracking deaths due to COVID-19 is the most accurate measure of the spread of the disease in Virginia, since it is likely that nearly every death gets reported. But the Centers for Disease Control (CDC) and state guidelines for counting deaths as COVID-19 deaths seem . . . questionable. There is an important distinction to be made between somebody dying of COVID-19 and somebody dying with COVID-19, and this does not seem to be properly accounted for.
I have also included an estimated death rate in light blue, which is calculated using the reported deaths and the estimated number of cases. Data suggests that only about 0.25% of cases cause death.
Deaths Per Day (Virginia)
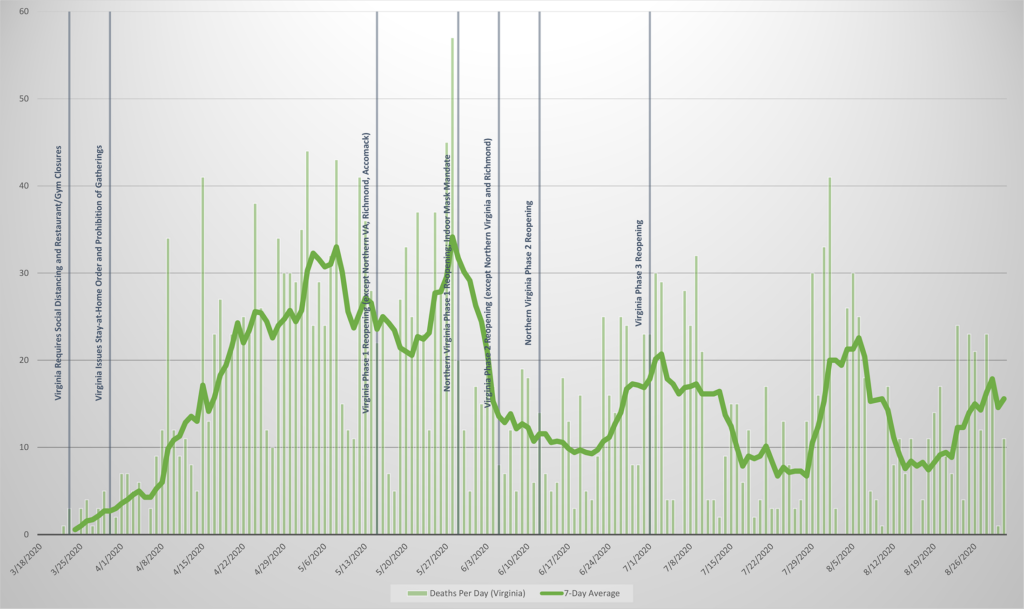
Just as total cases and total hospitalizations per day are more useful measures than the raw counts, the number of deaths per day is more useful than the raw count of deaths. This is, however, affected by the questionable reporting practices described above. Also, because the numbers are much lower than the numbers of cases and hospitalizations, it is more subject to wild swings that don’t represent the actual trends.
Doubling Rates (Virginia)
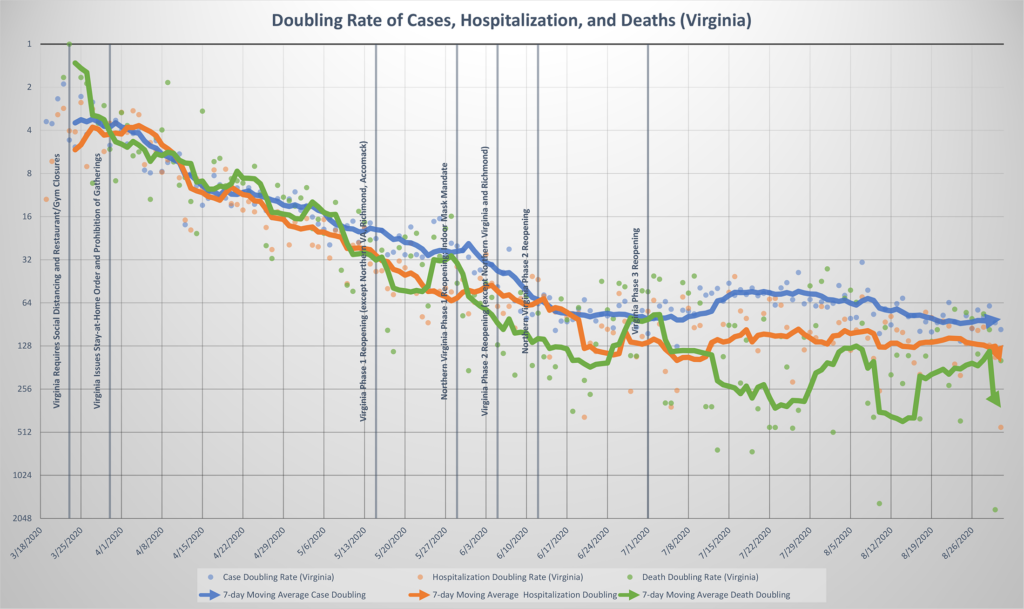
All of the above charts are useful and help us to understand how things are going in Virginia’s effort to limit the spread of COVID-19, but the gold standard—which gets far too little attention in the mainstream press—is the chart of changes in the “doubling rate.”
In this case, where our data has granularity to the day, we are interested in how many days it is expected to take for the number of cases, hospitalizations, and deaths to double. To calculate this, you figure out each day what the percentage increase in cases, hospitalizations, or deaths is, and figure how many days it would take based on that rate for the total number to double. You want this number to increase, since a higher number of doubling days means that the spread of the virus is slowing down. In order to illustrate this consistently with the above charts, I have inverted the Y axis.
Because this is a fairly abstract calculation that is heavily influenced by day-to-day fluctuations, I have charted these values as a scatter plot and emphasized the seven-day rolling average. Known cases, hospitalizations, and deaths are all included in a single chart.
Loudoun County
Total Cases (Loudoun)
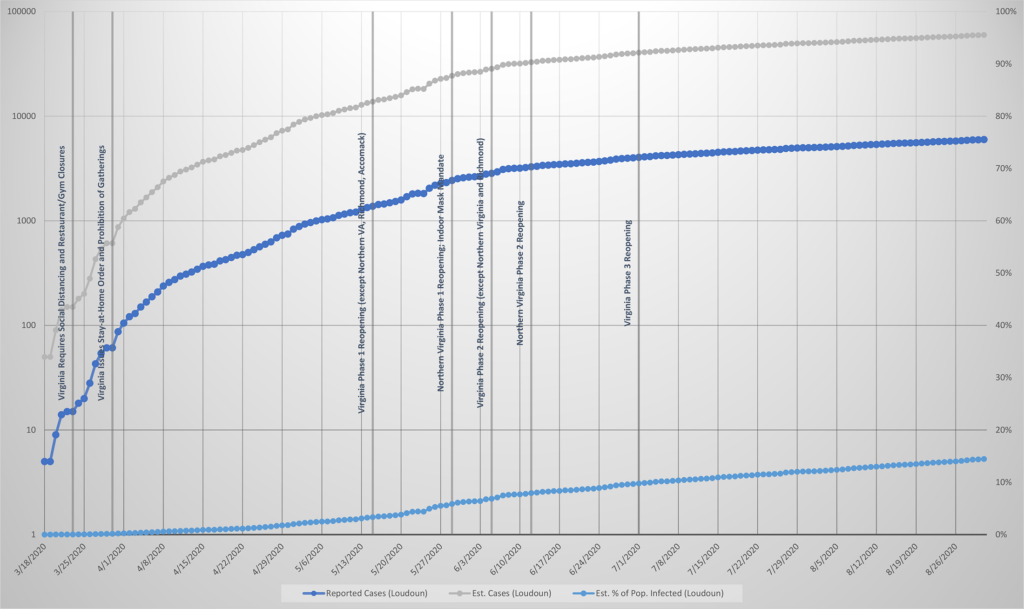
The county-level number of cases suffers from the same problems as the sitewide equivalent. It, too, will always be going up, since every new case increases the cumulative total, and it is difficult to distinguish how much of the increase is actual new cases and how much is connected just to the availability of testing.
Also included in this chart is an estimate of total cases (reported cases multiplied by ten, based on studies like one published in JAMA which have found that “it is likely that greater than 10 times more SARS-CoV-2 infections occurred than the number of reported COVID-19 cases”), and a percentage of population infected (estimated cases divided by U.S. Census Bureau estimate of Loudoun County’s population).
(Note: There is a data anomaly in the VDH reporting for May 24, 2020, where the total number of cases in Loudoun County dropped by ten from the day previous. This anomaly remains uncorrected in the VDH data and is shown in the chart below.)
Cases Per Day (Loudoun)
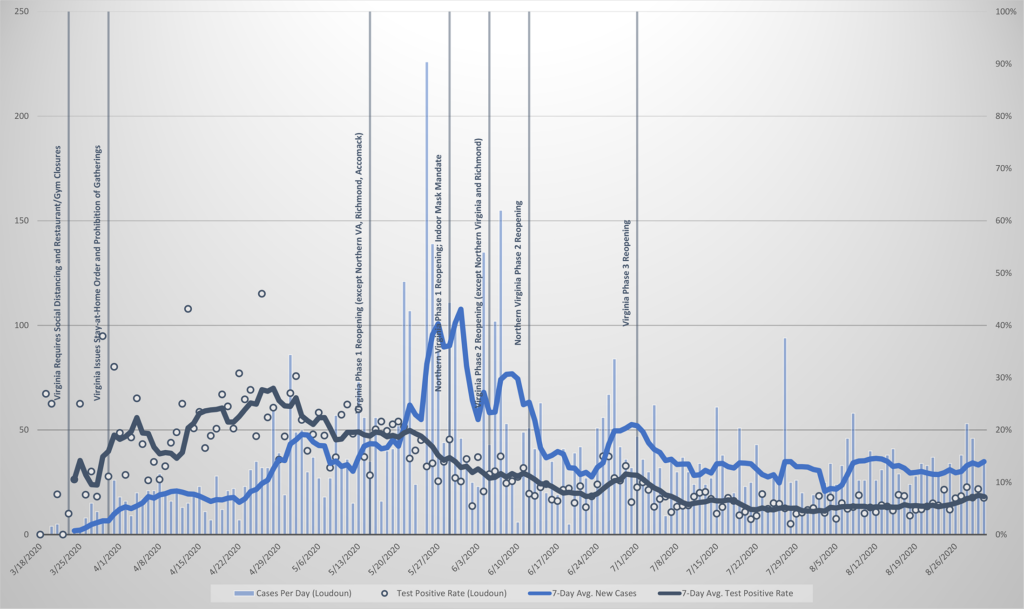
It is more helpful to look at how many new cases are identified each day, but it is still very difficult to tell how much of the increase is due to real spread of the virus and how much is due to the increased availability of testing. A more useful measure, overlaid here, is the percentage of tests returning positive.
(Note: The daily test positive rate data from VDH often has a one or two day delay, which is why the daily test positive rate may have one or two missing data points at any given time.)
Total Hospitalizations (Loudoun)
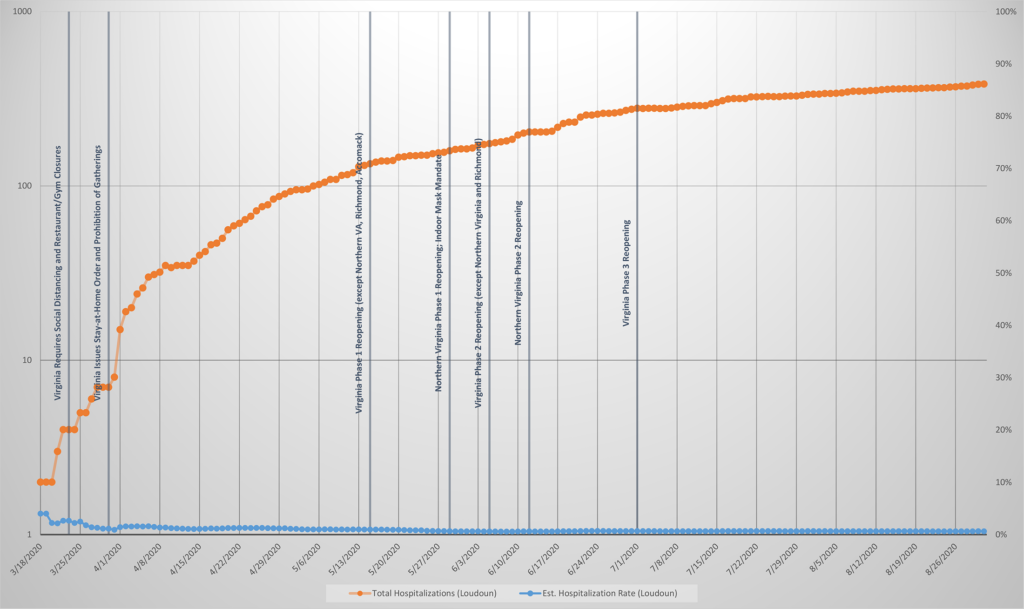
Tracking the total number of COVID-19 hospitalizations in Loudoun is likely a better measure than tracking the raw total of cases. We can assume that the rate of hospitalizations as a percentage of total cases is pretty consistent from day to day, and it is much easier to track accurately than total cases.
I have also included an estimated hospitalization rate in light blue, which is calculated using the reported hospitalizations and the total estimated number of cases. Only about 0.66% of cases in Loudoun require hospitalization, which is below the statewide average.
Hospitalizations Per Day (Loudoun)
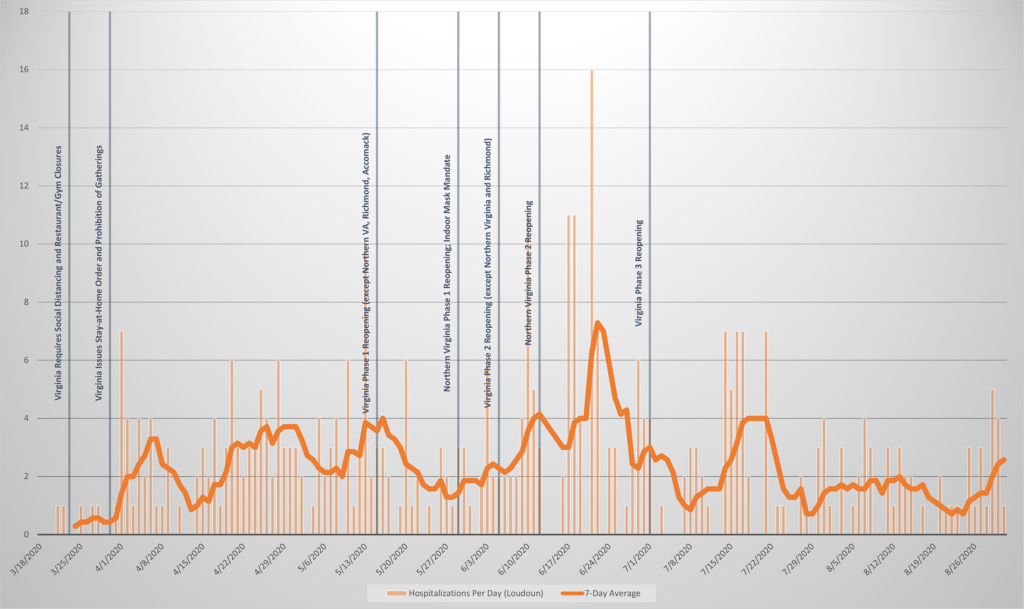
Like the number of new cases per day is probably a better measure of progress than the raw chart of total cases, likewise a chart of new hospitalizations per day is more useful than the chart of total hospitalizations.
Total Deaths (Loudoun)
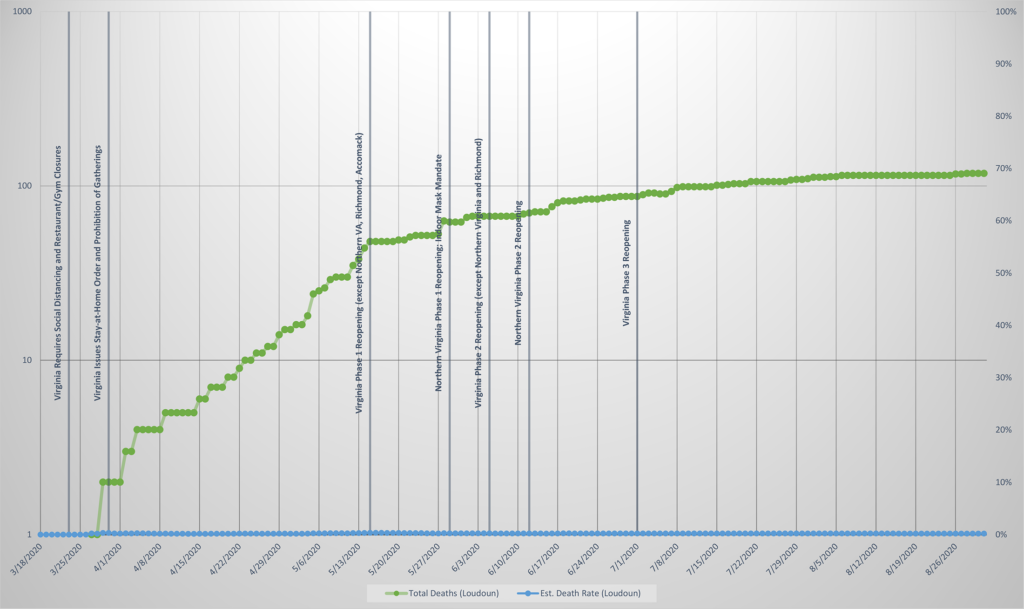
As described in the statewide summary of total deaths, the Centers for Disease Control (CDC) and state guidelines for counting deaths as COVID-19 deaths seem . . . questionable. There is an important distinction to be made between somebody dying of COVID-19 and somebody dying with COVID-19, and this does not seem to be properly accounted for.
I have also included an estimated death rate in light blue, which is calculated using the reported deaths and the total estimated number of cases. Only about 0.2% of cases in Loudoun lead to death, which is slightly below the statewide average.
(Note: There is a data anomaly in the VDH reporting for May 29, 2020, where the total number of deaths in Loudoun County dropped by one from the day previous. This anomaly remains uncorrected in the VDH data and is shown in the chart below.)
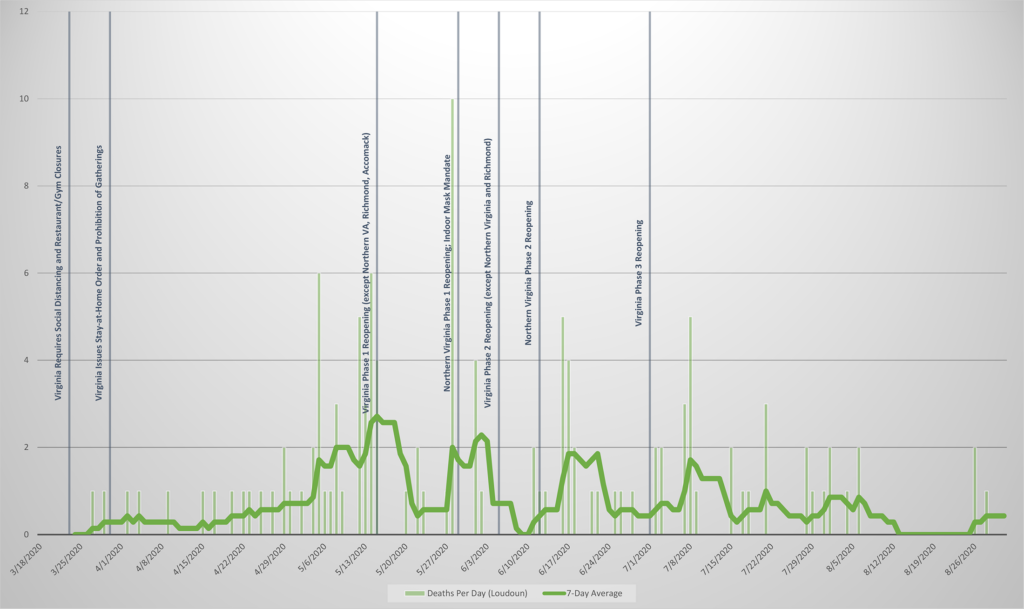
Deaths Per Day (Loudoun)
Just as total cases and total hospitalizations per day are more useful measures than the raw counts, the number of deaths per day is more useful than the raw count of deaths. This is, however, affected by the questionable reporting practices and small numbers described above.
Doubling Rates (Loudoun)
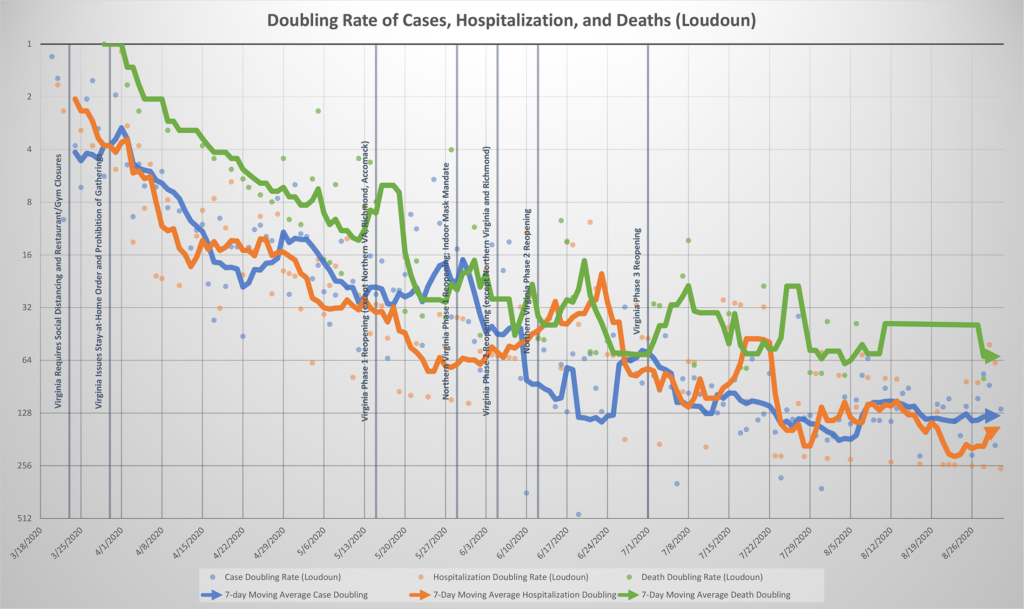
The gold standard for tracking the process of the epidemic is, as described in the statewide report, the chart of changes in the “doubling rate.” How these numbers are computed is described above and is not repeated here.
Because this is a fairly abstract calculation that is heavily influenced by day-to-day fluctuations, I have charted these values as a scatter plot and emphasized the seven-day rolling average. Known cases, hospitalizations, and deaths are all included in a single chart.
Restrictions In Place
Citizens of Virginia are under a number of emergency orders and restrictions. To the best of my knowledge, the following list includes all orders currently in effect that are likely to have noticeable impacts for the average Virginian. This list will be updated when new orders are issued, or old ones expire or are rescinded.
Executive Order 51 (State of Emergency)
- Effective:
- March 12, 2020
- Expires:
- Unknown (remains in effect until amended or rescinded)
- Summary:
- Activates the Virginia Emergency Operations Center and the Virginia National Guard.
- Allows for the temporary waivers of state requirements and regulations.
- Authorizes state funding for emergency response.
Executive Order 63 (Face Coverings)
- Effective:
- May 29, 2020
- Expires:
- Unknown (in effect until amended or rescinded)
- Summary:
- All people over the age of ten must wear a face covering when entering, exiting, traveling through, or spending time in most public places of business, public transportation, government buildings, and other indoor places outside the home. There are exceptions for eating and drinking, exercising, and persons with health conditions that prohibit face coverings.
Executive Order 67 (Reopening Phase 3)
- Effective:
- July 1, 2020
- Expires:
- Unknown (in effect until amended or rescinded)
- Summary:
- Restaurants and other dining establishments must seat parties at least six feet apart.
- Requires retail stores, personal grooming businesses, and religious services to enforce physical distancing and other restrictions.
- Allows fitness and exercise facilities, including pools, to open at seventy-five percent capacity with social distancing and other requirements.
- Allows indoor entertainment businesses including theaters, concert venues, museums, bowling alleys, and amusement parks to open at fifty percent of occupancy capacity up-to one thousand people
- Prohibits all public and private gatherings of more than two hundred and fifty people.
Executive Order 68 (New Restrictions in Eastern Region)
- Effective:
- July 31, 2020 (Eastern Region only—Virginia Beach, Chesapeake, Norfolk, Suffolk, Portsmouth, Hampton, Williamsburg, Newport News, Poquoson, James City County, and York County)
- Expires:
- Unknown (in effect until amended or rescinded)
- Summary:
- Closes bars and late-night restaurant service.
- Restaurants and other dining establishments may not exceed fifty percent occupancy and parties limited to fifty patrons or less.
- Prohibits all public and private gatherings of more than fifty people.
- Other than the above changes, E.O. 67 remains in effect in the Eastern Region.
Summary
Most of Virginia
Across the Commonwealth of Virginia, the ‘curve’ of the COVID-19 epidemic has been flattened and we are now well past the peak. The doubling rates are now all at or above sixty days and the key metrics are trending in the right directions.
Most of Virginia met the key criteria for Phase 1 reopening on May 4, 2020. Governor Ralph Northam (D) did not permit the state to enter Phase 1 until May 15, eleven days late.
Most of Virginia met the key criteria for Phase 2 reopening on May 18, 2020. Governor Northam did not permit the state to enter Phase 2 until June 5, eighteen days late.
Most of Virginia met the key criteria for Phase 3 reopening on June 1, 2020. Governor Northam did not permit the state to enter Phase 3 until July 1, thirty days late.
Most of Virginia met the key criteria for a complete reopening on June 15, 2020. Governor Northam has not yet allowed the state to fully reopen; we are now well over two months behind in the reopening process.
Governor Northam should allow most of Virginia to fully reopen immediately, excluding only those specific jurisdictions that do not yet meet the gating criteria.
Loudoun County
Loudoun County is performing roughly in-line with the rest of the state, although it met most of the key metrics about two weeks after most of the state.
Loudoun County met the key criteria for Phase 1 reopening on May 11, 2020. Governor Northam and the Loudoun County Board of Supervisors did not permit the county to enter Phase 1 until May 29, eighteen days late.
Loudoun County met the key criteria for Phase 2 reopening on May 25, 2020. Governor Northam and the Loudoun County Board of Supervisors did not permit the county to enter Phase 2 until June 12, eighteen days late.
Loudoun County met the key criteria for Phase 3 reopening on June 8, 2020. Governor Northam and the Loudoun County Board of Supervisors did not permit the county to enter Phase 3 until July 1, twenty-three days late.
Loudoun County met the key criteria for a complete reopening on July 13, 2020. Governor Northam and the Loudoun County Board of Supervisors has not yet allowed the county to fully reopen. We are now well over a month behind in the reopening process.
Virginia Governor Ralph Northam (D) should modify Virginia’s policies to allow county-by-county management of our mitigation efforts based on the actual conditions in each locality, and impose only the minimal necessary restrictions given those conditions.
Changes in Reporting
- April 29, 2020:
- Added a summary of official restrictions in Virginia.
- May 1, 2020:
- Charts of day-to-day changes will now feature a seven-day rolling average line (was previously a three-day rolling average).
- All charts now feature markers indicating important changes in statewide restrictions and federal guidance.
- In addition to statewide charts, this post now also includes the equivalent charts for only Loudoun County.
- Addition of a brief summary of progress.
- May 10, 2020:
- The Virginia cases-by-day chart will now include Virginia Department of Health data about the percentage of tests returning positive.
- The Virginia hospitalizations-by-day chart will now include Virginia Department of Health data about the total utilization of available hospital beds, and the percentage of those utilized beds being used by COVID-19 patients.
- May 16, 2020:
- The tracking of positive cases per day typically lags the other data by one day. Due to a spreadsheet error, this was not correctly shown in the chart. This issue has been corrected.
- May 18, 2020:
- Tracking of positive cases per day will now be primarily in a rolling seven-day average for easier comparison with other metrics. The actual values are now shown on the chart as scatter plot markers.
- Tracking of positive cases per day is now displayed on the Loudoun County cases per day chart, as this information is now available in the VDH data sets.
- June 10, 2020:
- The Virginia and Loudoun County doubling rate charts will now be presented on a base-2 logarithmic scale, which makes it easier to see trends despite some very high one-day values.
- June 23, 2020:
- The Virginia and Loudoun County charts of total cases, hospitalizations, and deaths will now be presented on base-10 logarithmic scales to more clearly show the effectiveness of our efforts to “flatten the curve.”
- August 14, 2020:
- Added overlay of the estimated hospitalization and death rates in Virginia and in Loudoun County. This is calculated by dividing the total number of hospitalizations or deaths by ten-times the number of reported cases. This calculation is based on a well-executed study published in JAMA that found that “it is likely that greater than 10 times more SARS-CoV-2 infections occurred than the number of reported COVID-19 cases.”
- August 15, 2020:
- Added overlay of the number of estimated cases (reported cases times ten, as described in the August 14 update) and estimated percentage of population infected to the case tracking charts.
- August 31, 2020:
- I am ending ongoing daily updates to the post. Virginia’s metrics are all stable and moving in the right direction, and there is no longer any reasonable justification for maintaining a state of emergency (see The Emergency is Over). Coverage may be reinstated if Virginia experiences a serious spike or if conditions significantly worsen.
- September 2, 2020:
- Performed an update to the charts with latest VDH data (still only charted through August 31) to ensure completeness through the end of August, especially for lagging reports like the percentage of tests reported positive.
- September 7, 2020:
- Performed another update to the charts with the latest VDH data through August 31 to update for lagging reports. Assuming no significant changes to conditions in Virginia, I am planning no further updates.


